The shape of memory issues
Memory issues are hard to deal with. Forgetting where your keys are or a memory leak in software, both can be annoying in various degrees. This article will focus mostly on the latter and specifically for Ruby environments. The generic knowledge can be applied to any garbage collected programming language, so if you’re reading this with a Java background I hope this is as useful.
Throughout the case study I will give some handlebars and things to look out for while debugging, however I will try to refrain from too much technical jargon, because while trying to make my way to a solution, I found the more tech-heavy memory articles unhelpful to say the least. It starts out by explaining the title of the article, followed by a case study and ending in a conclusion.
The shape of memory issues
There are three distinct shapes you should be frightened of and I’ll list them from least worrying to most worrying:
Memory bloat:

The memory jumps up significantly. Some memory is freed along the way, but overall the total memory will grow in large quantities in small amounts of time. The total accumulated memory keeps persisting and eventually it will cause the memory to overflow.
Memory fragmentation:

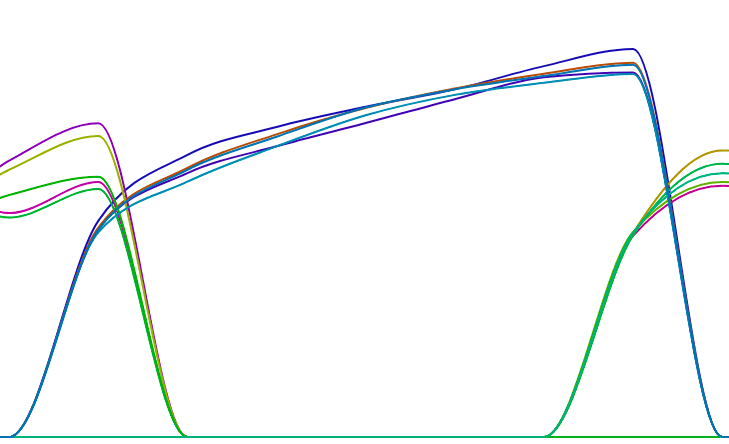
The shape of memory fragmentation is logarithmic. This means the total memory used will grow and grow and will try to reach a point it can never reach. Usually these issues are slow-moving.
Memory leak:

The shape of a memory leak is linear. The total memory use will go up and up in a linear fashion and eventually it will run out. Much like fragmentation, these issues are slow-moving.
In theory these are the three core ‘memory issue shapes’ relevant to the upcoming case study. It is also possible to combine either one of these shapes to form an entire new shape. With this knowledge, what does this look like to you:
A backend and a patch; a case study
And now for the actual hair-pulling:
There once was a Ruby backend; it’s written in Sinatra, it runs on a bunch of puma servers and has a bunch of background workers for longer running jobs. It’s nothing too out of the ordinary, except that the puma servers ran out of memory on September 10th, 2018. It caused a partial outage, but nothing too bad. The next day an engineer was assigned to the problem and naturally he had a choice to make: investigate the problem for a couple of weeks and fix it, or patch it. At the time it was rather busy, so we decided to patch it. We introduced a gem that would restart our puma servers every hour to free up memory.

We were however aware that we still needed to do some actual research in how this could have happened. On December the 14th, of the same year, a small investigation occurred in which we concluded that our little Ruby backend wasn’t leaking memory. The gem was working fine, so the incentive to further investigate this issue was not a focus point any more, and we closed the issue.
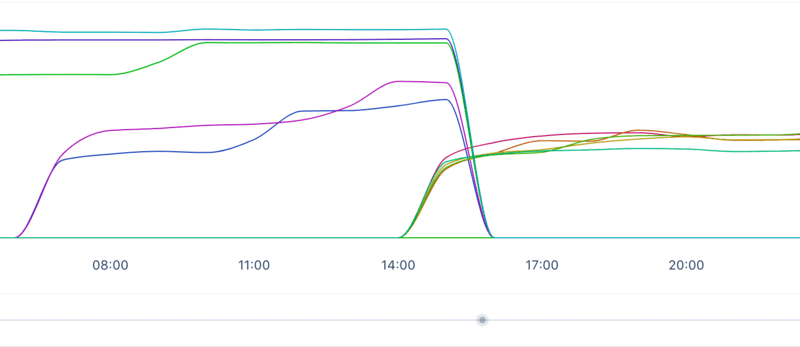
Christmas 2018 happened, which was a pretty good Christmas if you asked me. New Years Eve came around and eventually it became 2019. Valentine’s Day and the Easter bunny came around and when, on June 25th 2019, the weather in the Netherlands finally started to look fine, a new version of puma was released. Because of this newer version – and you guessed it – our restarting patch became incompatible, so we had to remove it. After a deploy we figured that we still hadn’t fixed the original memory issue, so we reverted to the older version including our patch. The interesting bit here, was to figure out what the memory looked during the deploy with the newer version of puma:
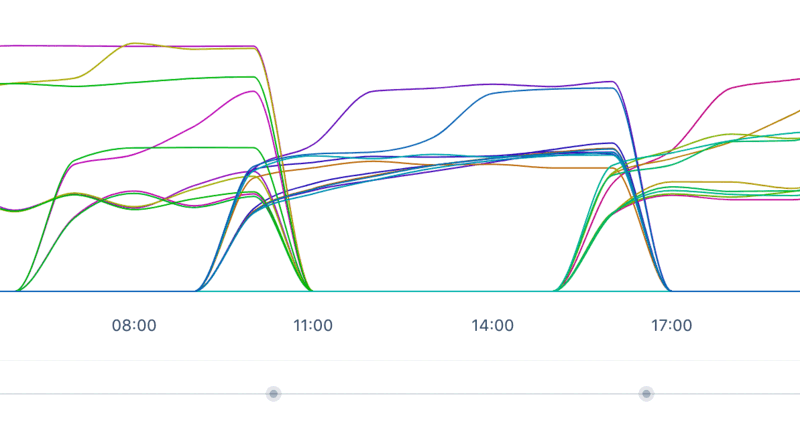
When filtering out the puma servers:
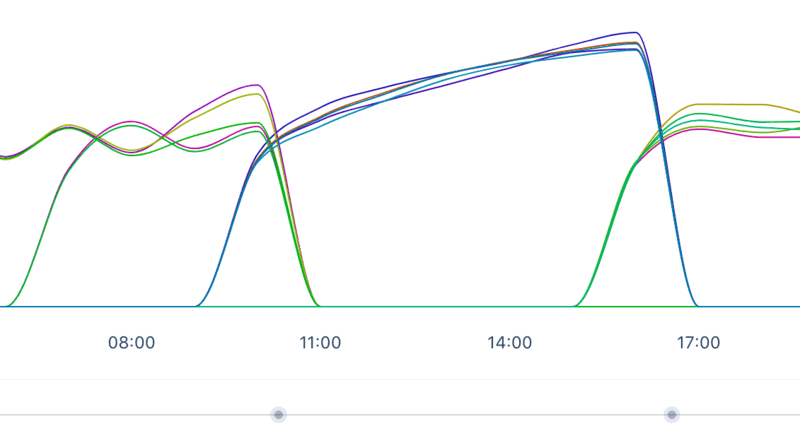
… and when filtering out the background workers:
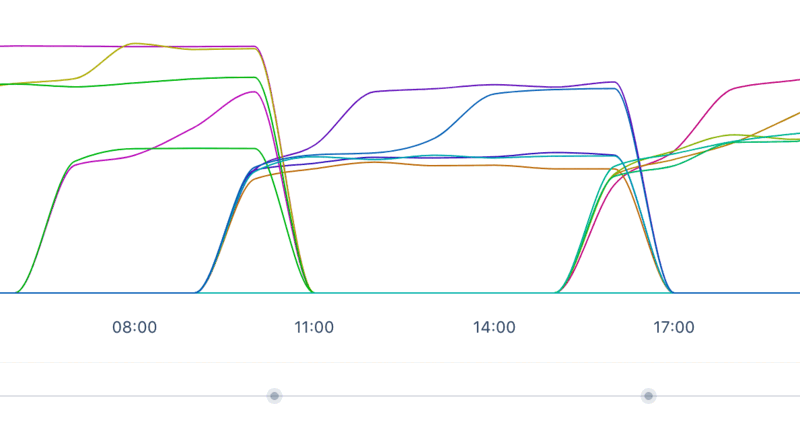
Not only did we have one memory issue, we had in fact two memory issues. Let’s go over them from least frightening to most frightening.
Bloaty background workers
To scroll back up to the three memory shapes; the shape of the background memory usage chart, as shown above, looks rather familiar. Memory is being allocated and because of its size, Ruby thinks that this particular piece of memory must be important, so it persists it for quite a while. After an hour it increases again; rinse and repeat. It’s classic memory bloat.
It turned out that there was a cronjob whose sole purpose was to read logs, compress them, store them elsewhere for safekeeping and delete them. Our backend grew and grew, so we naturally acquired more logs. The logs were persisted in a single array and then compressed, wherein lied the issue. This array became incredibly large and this compressing naturally had to be done in batches. After fixing it, the problem went away and our memory looked good and healthy again for the background workers:
One down, one to go!

By simply looking at this graph, it looks like a leak. The shape is linear, what more information do I need? However, back in December 2018 we concluded it wasn’t a leak. Considering all possibilities, my first hypothesis was that the investigation back in December was incorrect and the shape of the graph indicated that it must be a leak.
I had to find this leak and changed two things in our backend to find it: I installed a tool called rbtrace on our production environment and naturally I had to drop our puma server restarting patch. I deployed these changes and started to measure away. Because memory leaks take a while to reveal their ugly face, I had to wait a bunch of hours between taking measurements. I also had to remind myself to revert everything back to normal when the day was over, in case it would run out of memory at night.
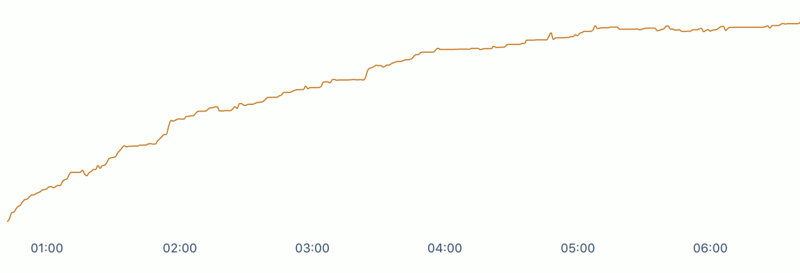
After keeping our backend running for a long time without the restart patch, it produced this image. Looking at it today, I can now clearly see that this is not a leak. However, at the time when I made this screenshot, I was still convinced the puma server was leaking memory, knew nothing about memory fragmentation and naturally I couldn’t find anything which even remotely smelled like a leak.
The logical next theory in finding this ninja leak would be that an underlying C-library was leaking in one of the Ruby dependencies. The way to measure this according to some articles I read, was to compile Ruby with jemalloc.
Excerpt rbtrace results:
| Time | RSS Size (pmap) | Total heap size (rbtrace) |
|---|---|---|
| 8:57 | 1.89GB | +/- 38.12MB |
| 13:25 | 1.95GB | +/- 38,12MB |
Simultaneously I was analysing the rbtrace results and found them to be rather strange. When checking the memory usage of the actual puma server and comparing it with the actual size that Ruby is aware of, it turned out that Ruby forgets quite a big chunk of it. Ruby, in a way, suffers from Alzheimer’s disease.
All of this left me rather confused and a bit frustrated. I was walking around trying to make sense of it, while another coworker was overhearing me sighing rather loudly when I was going to the toilet. He asked what was going on and I explained this particular problem. He said that he once read an article about this memory discrepancy in Ruby, and he would link it to me. I briefly skimmed the article and there was a striking image in there:

See! Ruby has Alzheimer’s disease.
After learning about Ruby’s forgetfulness, I knew I couldn’t really rely on the results of rbtrace. Instead, I started to pry around in the actual memory itself, to see if I could learn anything from it. To do this, you need to have some Linux knowledge and especially how to access memory; or rather how to turn working memory into actual files on disk. There are a couple of helpful commands to search for namely: pmap and gdb. After acquiring that data and doing a bit of analysis, I found that there were large blobs of memory retained for large periods of time. Upon checking what was stored inside these larger blobs, I found that they were mostly response bodies from requests to the puma server which were a little to beefy. This finding changed the conclusion of the problem to memory bloat. Retaining memory over a long period of time, while not cleaning it up is classic memory bloat. However, the chart doesn’t line up with this conclusion.
I also continued with the leaking C-library theory because, to my mind, that also had some merit. I deployed the ‘Ruby with jemalloc’-solution to production to actually prove this theory, while having the benefit of real life production traffic. To my surprise it solved our memory issue:
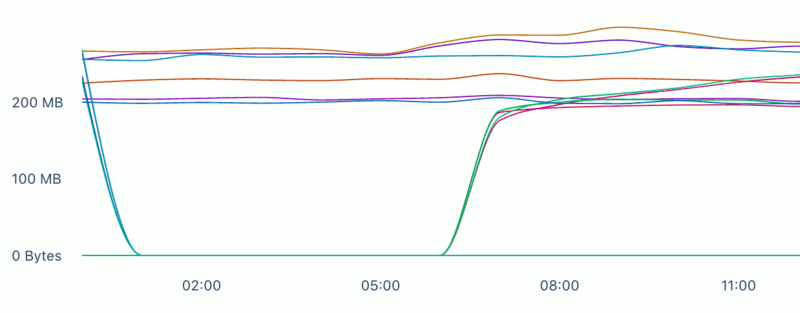
I was happy that it was fixed, but at the time I didn’t understand why this solution even remotely worked. However, what I can safely say is this: a side-effect of compiling Ruby with jemalloc, is that jemalloc starts to combat memory fragmentation. The puma workers were experiencing this particular memory issue. On top of this, my other conclusion of it being memory bloat was also correct. Imagine if you were to combine both memory bloat and memory fragmentation into a single shape, it will start to look linear. This in turn will give you the false idea that it’s a memory leak, when looking at it for a short period of time.
In conclusion
Memory issues within software are always unique cases and there’s usually no standard solution to fix them; StackOverflow or the likes will not have the answer. Having said that, there are generic shapes that emerge, while measuring memory usage, that can point you to a potential solution and the right tooling. To repeat the three distinct shapes: big increases in relative short periods of time (memory bloat), logarithmic growth (memory fragmentation) and linear increase (memory leak).
When you’re dealing with a leak or fragmentation, measure memory usage over a longer period of time. Use the right tool to measure memory usage and try to use out of the box memory tooling that is available within the provided infrastructure. For example: if you’re using a Linux environment, use pmap. To finish with some wise words: remain patient and don’t rush towards a solution in any of these cases. Measure, measure, measure and .. I just remembered where I left my keys.
